
Published on :- 14 March 2025
What is Technical Analysis? A Complete Guide for Traders
Technical analysis is a method used by traders to predict future price movements of stocks, commodities, or any other financial assets. It is based on past price data, trading volume, and other market-related factors. Unlike fundamental analysis, which focuses on company performance, technical analysis only studies price charts and patterns.
Why is Technical Analysis Important?
- Helps traders understand price trends.
- Provides signals for buying and selling stocks.
- Identifies market trends and reversals.
- Assists in risk management by setting stop-loss points.
Technical Analysis for Beginners
Understanding Price Charts
Price charts are the foundation of technical analysis. Traders use different types of charts to study price movements.
Types of Charts
- Line Chart: A simple chart that shows the closing price over a period.
- Bar Chart: Displays opening, closing, high, and low prices for a particular time frame.
- Candlestick Chart: A widely used chart that provides detailed price movements in a visual format.
Key Concepts in Technical Analysis
Support and Resistance
Support is the price level where a stock tends to stop falling and may bounce back up. Resistance is the price level where the stock tends to stop rising and may fall back down.
Trend Lines
Trend lines are drawn on price charts to identify the direction of the market. There are three main trends:
- Uptrend: When prices move higher over time.
- Downtrend: When prices move lower over time.
- Sideways Trend: When prices move within a range without a clear direction.
Common Technical Indicators
Moving Averages
Moving averages help smooth out price data and identify trends. The two common types are:
- Simple Moving Average (SMA): The average price over a certain number of days.
- Exponential Moving Average (EMA): Gives more weight to recent prices for better trend identification.
Relative Strength Index (RSI)
RSI measures the strength of a stock's price movement. A value above 70 indicates an overbought condition, and below 30 indicates an oversold condition.
MACD (Moving Average Convergence Divergence)
MACD is used to identify changes in momentum by comparing two moving averages.
Stock Market Technical Analysis in Practice
How to Read Stock Charts
To analyze stocks, traders look for patterns like head and shoulders, double tops, and flags. These patterns help predict future price movements.
Setting Stop Loss and Take Profit
A stop-loss order helps limit losses by automatically selling a stock when it reaches a certain price. A take-profit order locks in gains by selling a stock at a predetermined profit level.
Common Mistakes to Avoid in Technical Analysis
- Relying on a single indicator without confirmation.
- Ignoring market trends and trading against them.
- Overanalyzing and complicating decisions.
- Not having a risk management strategy.
Technical analysis is an essential tool for traders who want to make informed decisions in the stock market. By understanding price charts, key indicators, and market trends, traders can improve their chances of success. Learning technical analysis for beginners takes time, but with practice, anyone can become skilled at stock market technical analysis.
Do you have any questions about technical analysis? Let us know in the comments!

About the author
Afraheem Ali
Candle Expert Academy, founded by Afraheem Ali, is a dedicated platform for learning the art and science of candlestick trading. With a focus on technical analysis, price action strategies, and risk management, the academy empowers traders with the knowledge and skills needed to navigate financial markets effectively.
Afraheem Ali, a seasoned trader and mentor, has years of experience in financial markets.
Candle Expert Academy, the goal is to develop confident, self-reliant traders. With structured learning modules, real-world case studies, and practical insights, students gain a deep understanding of market psychology and trading strategies.
Fundamental Analysis vs Technical Analysis: Which One Is Better?
Fundamental analysis looks at the core aspects of a company. When using fundamental analysis, an investor studies the companys financial health, its products or services, and the overall market.
READ MORE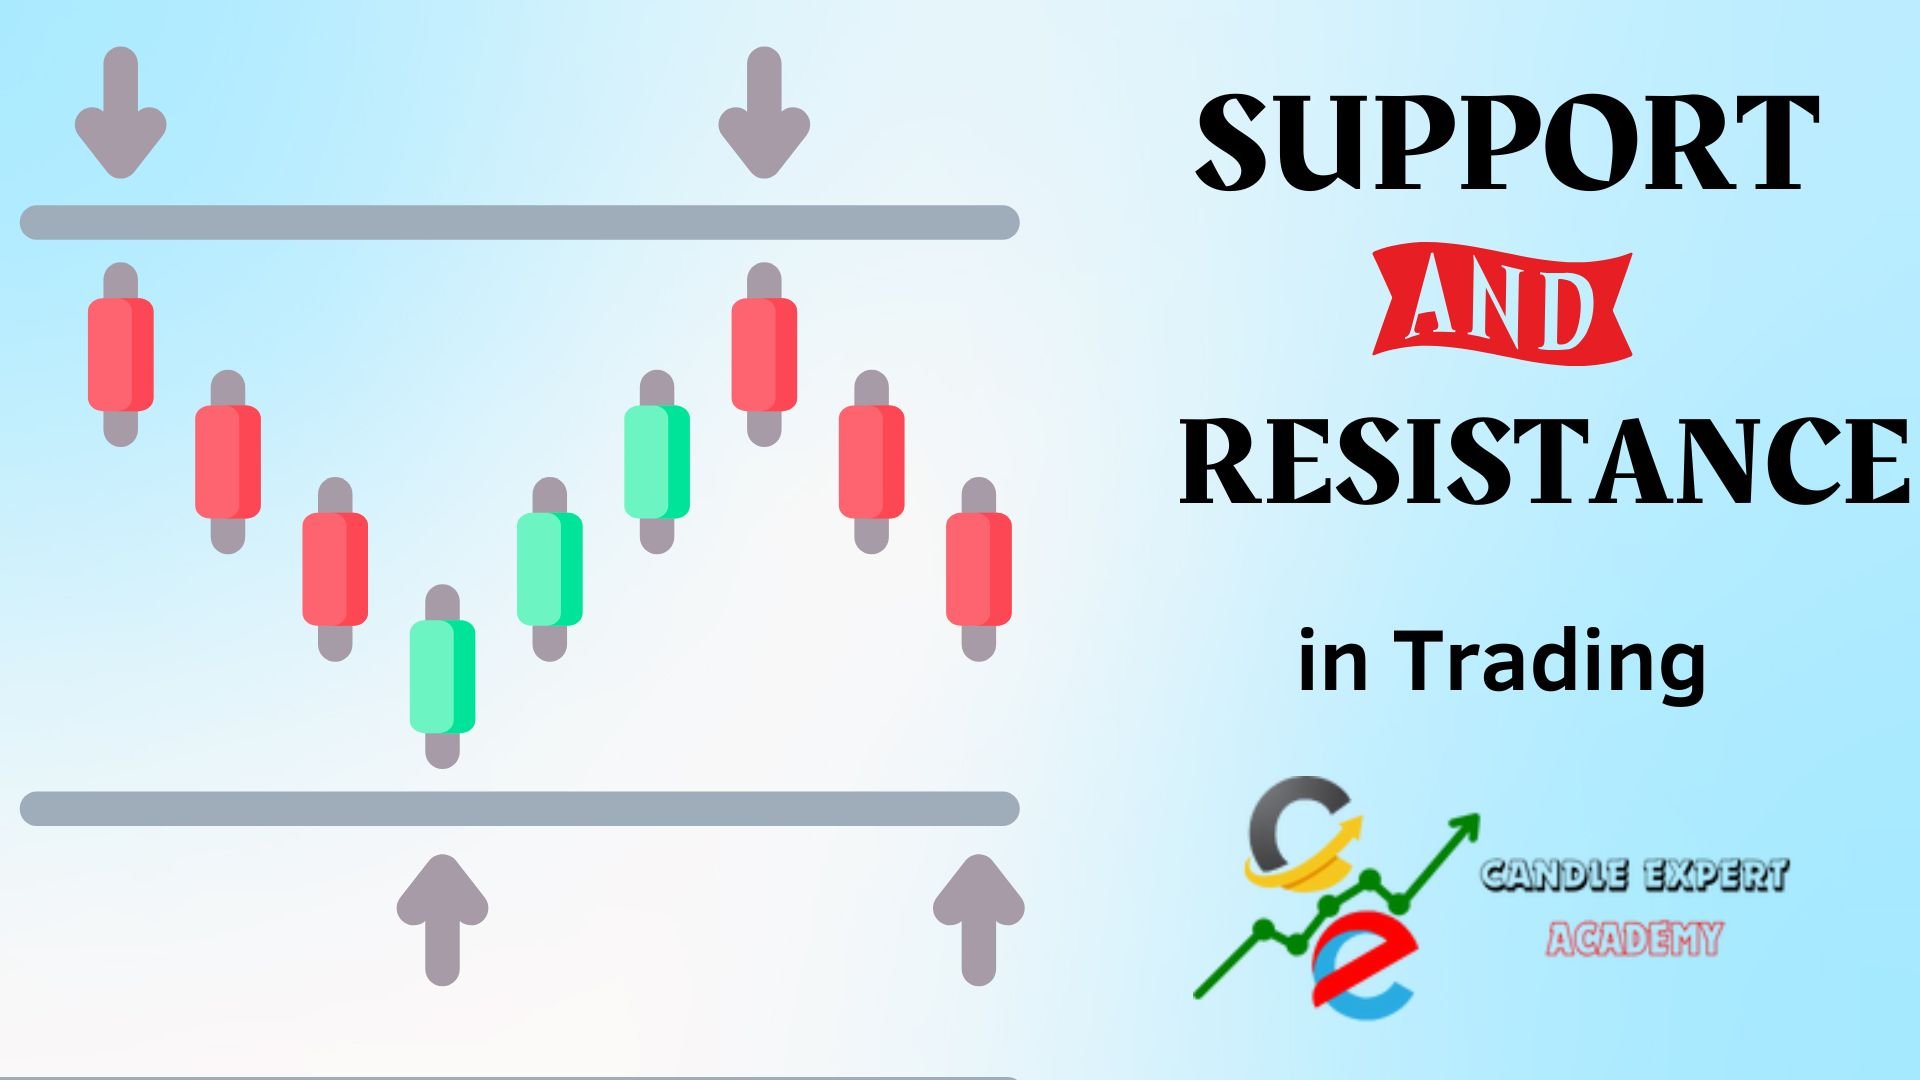
Support and Resistance in Trading: A Beginner Guide
Important ideas of support and resistance in the stock market. You will learn the basic ideas behind these key trading strategies.
READ MORE
How to Manage Risk in the Stock Market (Risk Management Guide)
Risk management helps traders and investors protect their money from large losses. The stock market can be unpredictable, and prices can change quickly. By using good risk management strategies, traders can reduce their losses and improve their chances of making profits.
READ MOREFundamental Analysis vs Technical Analysis: Which One Is Better?
Fundamental analysis looks at the core aspects of a company. When using fundamental analysis, an investor studies the companys financial health, its products or services, and the overall market.
READ MORESupport and Resistance in Trading: A Beginner Guide
Important ideas of support and resistance in the stock market. You will learn the basic ideas behind these key trading strategies.
READ MOREHow to Manage Risk in the Stock Market (Risk Management Guide)
Risk management helps traders and investors protect their money from large losses. The stock market can be unpredictable, and prices can change quickly. By using good risk management strategies, traders can reduce their losses and improve their chances of making profits.
READ MORE